
The visuals on your website are meant to provide an enriching, compelling and engaging visual experience for your visitors.
They’re also an important tool for driving action and making your website more effective. The photos and videos you use can play a huge role in its success, positively impacting performance metrics from engagement to conversions.
Here are some tactical ways travel and tourism marketers can increase their website conversion rates with photos and videos.
How to Use Images and Videos to Lift Your Conversion Rate
First, determine what “conversion” means to you
Depending on your website goals, your definition of “conversion” may differ. Ultimately, it’s the number of website visitors who take a desired action, as defined by you.
If you’re a resort, hotel or tour operator, your most important metric is probably the number of bookings you receive on your website. As a DMO, conversion may have a few different meanings. It could be visitor guide downloads, newsletter signups, or driving traffic to partner websites.
Whatever it is, you need to define it before you can measure it.
Make sure you’re set up to track visual metrics
Before you do anything else, make sure you’re accurately tracking your website performance and visual metrics with whatever analytics tool you use.
This lets you do before-and-after comparisons, see how your website visitors are interacting with your content, and determine whether or not your visuals are making a difference to your conversion rate.
Use UGC alongside your owned visuals
User-generated content — visuals your visitors are already posting on social media — can be really effective in improving website performance. Consider these stats:
- 90% of people say that user-generated content informs their purchasing decisions.
- Websites that incorporate UGC can see a 20% uptick in the number of return visitors.
Your website is a natural fit for UGC, and it gives your visitors a reason to stick around.
Travel and tourism brands have seen success when adding UGC to their website, like Discover The Palm Beaches. They relaunched their website to include user-generated content, and also used it in other channels with their “Friends Trust Friends” campaign.
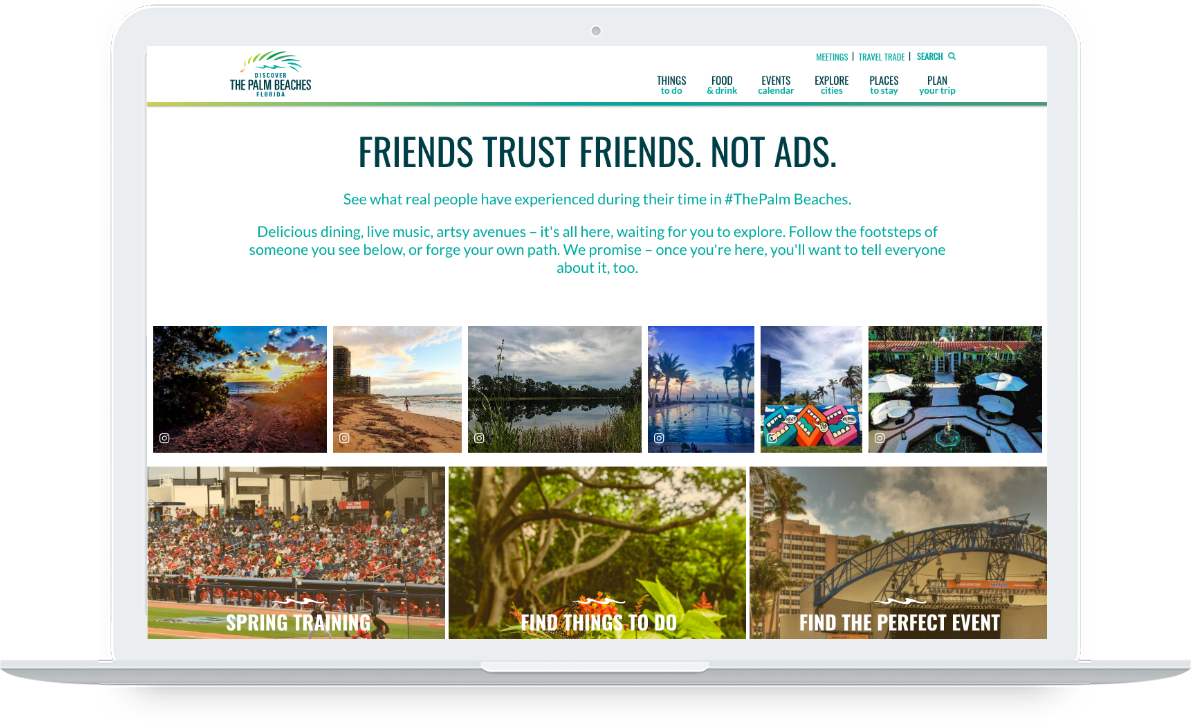
After they launched their website, ThePalmBeaches.com, they saw a 10% increase in average session duration and a 35% increase in conversions.
Show off your brand and experiences with curated visual galleries
Creating galleries for each page of your website is an easy and compelling way of showing off your destination, hotel, or tours. Not to mention, it keeps visitors engaged for longer and gets them clicking.
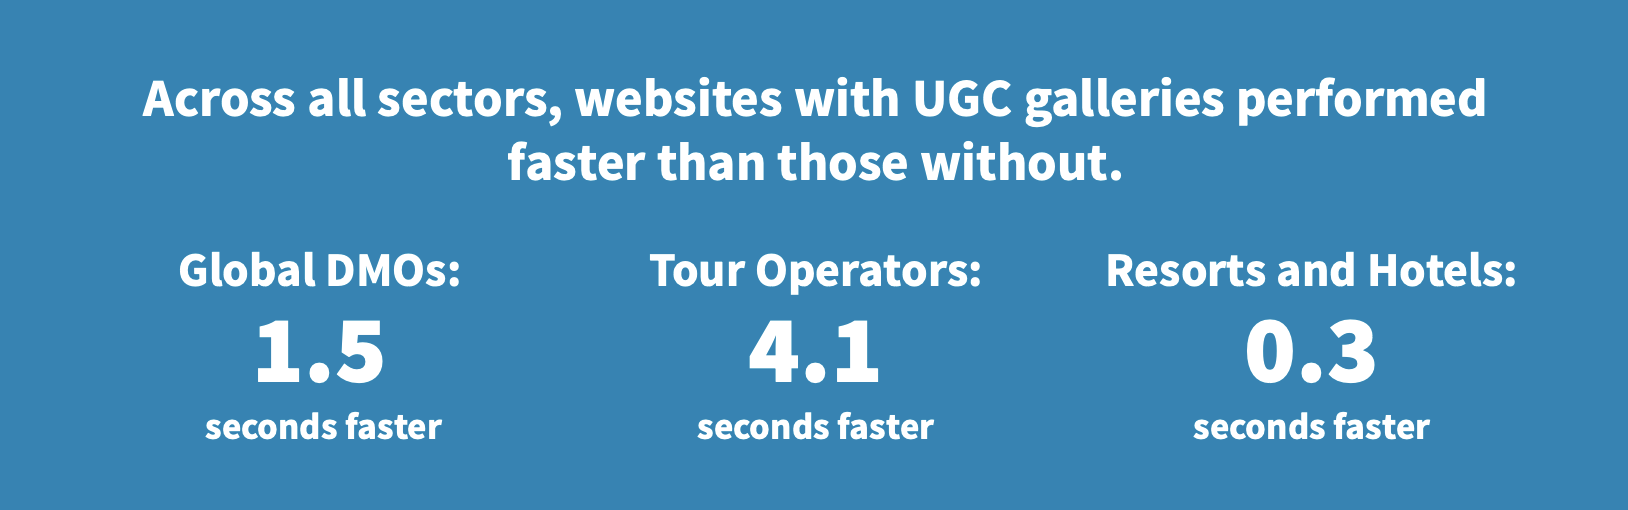
We recently did an analysis of over 100 travel and tourism websites, and found that websites with UGC galleries performed faster than those without them. Speed is important — the longer it takes for your website to load, the higher your bounce rate likely is, and the lower your conversions.
When adding galleries, curate each one around specific themes you want to promote. Not only does this help set yourself apart from the competition, but it lets your website visitors actually picture themselves in your destination or staying at your hotel.
CrowdRiff Tip: CrowdRiff’s Smart Galleries are self-optimizing. They automatically test each of the images in your galleries and prioritize the best performers, so your most engaging and clickworthy visuals are seen by more people, more often.
A/B test photos and videos to boost conversions
Better visuals lead to better results.
Identifying the images and videos that resonate the most with your audience will allow you to make more strategic decisions about the visuals to use on your website, and in other marketing channels.
Here are a few ways you can A/B test different types of visuals:
- UGC vs owned. This is a great way to determine whether user-generated content or your owned assets — like stock or commissioned photography — performs better on your website.
- UGC vs UGC. This is the best way to truly determine which UGC visuals work the best on specific channels!
- Image themes. Do photos with people in them convert better in your “Things to Do” gallery, or do photos of landscapes or attractions? Test different content themes to see what works best on each part of your site.
Here are a few areas where you can test performance:
- Website header. Your header image is the first impression your website gives visitors, so you should use your most powerful imagery here. Whether you testing UGC vs UGC, UGC vs owned, or photo vs video, switch out your header every so often and compare.
- Visual galleries. If you have galleries themed for specific pages, look out for the images that see the highest engagement and conversion rates. Then, optimize your galleries to include the best performing imagery, or add CTAs to the images that get people clicking.
- Digital ads. Your digital ads are a great way to test the clicks a certain visual can get. Try keeping the copy and call-to-action the exact same, but switch out the image used.
Once you’ve tested, optimize your website by using the highest performing visuals to help increase your conversion rate.
Use CTAs to drive action
Calls-to-action are an incredibly effective way to drive higher conversion rates and increase sales. When you add CTAs to your visuals, especially product images, you’re targeting visitors when they’re most engaged.
Let’s say you’re a resort and have a gallery on your homepage. By adding a “Book Now” CTA to the visuals in that gallery, you can drive visitors directly where you want them in the moment they’re inspired by one of your images.
Don’t just take our word for it — Dollywood added CTAs to the galleries on their website and drove over $90,000 in ticket sales in just 5 months.

This is also a great opportunity to test drive different CTAs to see which converts the best. In our travel and tourism website research, we found:
DMOs: 25% of DMOs are using CTAs that direct people to their social channels, while 15% use soft CTAs (like “Visit This Location”) to send people to partner websites or other pages on their website.
Tour Operators: a majority of tour operators use an offer CTA that directs visitors to their booking page (i.e. “Book Now” or “Book Machu Picchu”).
Resorts & Hotels: 45% of websites analyzed had CTAs that sent people to other pages on their website. Only 10% had CTAs that drove people directly to their reservation portal.
Figure out what website content is working — and isn’t working
So you’ve A/B tested your visuals, found the best ones, and added CTAs to them. Now where do you put them?
Use Google Analytics to find the pages that are seeing the highest traffic and resonating the most with visitors — as well as those that aren’t. With this insight, you can:
- Add CTAs to the images in your galleries that are seeing the most traffic.
- Add galleries to pages that aren’t performing well, so you can engage visitors when they land there.
- Understand which type of visuals resonate with certain demographics, so you can cater more of those images to them.
CrowdRiff Tip: If you’re a CrowdRiff and Google Analytics user, make sure you’ve turned on our Google Analytics integration. This lets you track how your website visitors are interacting with your visual galleries, from views to CTA clicks.
Add video to your content mix
Videos can help you capture the attention of website visitors who may not otherwise stick around. It’s an ever-growing medium that is wanted by consumers — 87% of people want to see more brand videos this year, and 90% say that videos help inform their purchase decision.
Adding a video to a landing page can increase conversions by 80%. Whether you use a video as your website header or embed it on the homepage, do a before-and-after comparison to see the difference it can make.
A sneak peek of CrowdRiff Insights
We’re working to help marketers take the guesswork out of their visual marketing strategy and better measure the ROI of their images.
We’ve just announced CrowdRiff Insights, which lets you see the impact your visuals have on your website performance metrics. Check it out!