“You can’t manage what you can’t measure.”
Any digital marketer will agree with management guru Peter Drucker’s famous words.
Especially in an environment where every dollar is under a microscope, measuring and proving the value of your marketing budget, your tools, and your own efforts are critical.
As a time-strapped destination marketer, what metrics should you be paying close attention to?
Your colleague might want to know how a recent campaign is performing on social media. Your boss might want to know how your website engagement has changed since COVID-19. And your board might want to know how the technology you’re using is saving your team dollars.
To help you better manage (and measure!) your marketing efforts right now, we’ve put together the top metrics our customers keep a close eye on, and why CrowdRiff is critical for moving the dial on each one.
- Your website engagement
- Your social media engagement
- Time saved per employee
- The value of your user-generated content library
Your website engagement
Do you know the value of a website visitor?
Destination Analysts studied the traffic of 13 U.S. DMO websites over a year, and found for every unique web visitor, $37 USD of new visitor spending was injected into each destination.
Though the study is a few years old, it points out how important it is to know the value of a new website visitor, and how crucial it is to keep these visitors engaged on your site.
The more you keep undecided potential travelers (or locals) on your website, the more likely you are to convert them into actual visitors (or locals who spend more money).
To measure website engagement, look at:
- Monthly visitors (by source). Aside from understanding what channels are working hardest for you, this will help you tie economic impact back to your website in the long run. For example, you’ll need to distinguish who came to you through Google, through social media, or to your website directly vs those who came from a trade show or other offline source.
- On Google Analytics (GA), go to Acquisition > Overview.
- Time on-page and session duration. This is an easy way to directly compare your web pages and identify which ones are performing well. You want a higher time on page on blogs, image-heavy pages, and booking information sources.
- On GA, go to Behavior > Site Content > All Pages.
- Pages per session. This is how many pages a user engages with when they go to your website.
- You’ll find this in Behavior > Overview.
- Bounce rate. Bounces measure people who come to one page and quickly leave. They are not immediately impressed with the information they see, the design of the page, or the experience loading the page.
- You can see the bounce rate under “Acquisition.”
- Conversions. Conversions can be set up in Google Analytics to measure bookings, subscribers to the email list, signups for blog notification, or shares of individual pages on social networks. Note you’ll need your goals set up to track this metric.
- Go to Conversions > Goals
How CrowdRiff improves Lake Wanaka’s website engagement
No matter if you’re marketing the city to locals or future travelers, you need people to stick around your website. As the study above showed, the more people you convert on your website, the higher your economic impact will be down the line.
Compelling visuals and calls-to-action are two ways to improve your website engagement.
In the immediate aftermath of COVID-19, Lake Wanaka’s page views, goals, and events were all down 62%. As expected, website visitors weren’t there looking to plan or book trips.
But Tess Hellebrekers, Visit Lake Wanaka Tourism’s Online Executive, explained when she looked at the website, “CrowdRiff galleries were down only 15% from before COVID-19, so there was about 4x better engagement than other parts of the website.”
In fact, from an engagement standpoint, some of their galleries were performing even better than the same month one year ago. Their Top 10 Things to Do gallery performed 134% better than one year ago, and their #LoveWanaka page was up 14% in terms of total views.
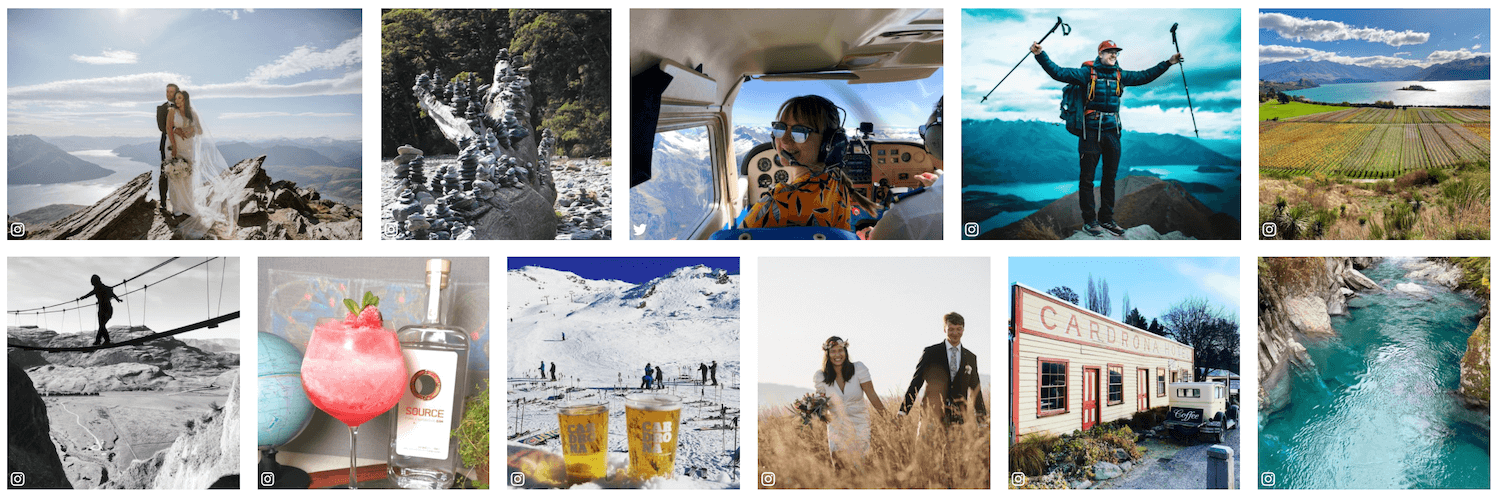
Tess explains she adds calls-to-action (CTAs) on every photo to send people deeper into the site or to partner pages.
The team also updates the content in the galleries every few days with compelling visual imagery from their community. They use a mix of “hero images,” inspiration content like beautiful landscapes that inspires people to travel, and “actionable images” to promote specific activities or attractions like food pictures, paddle boarding, and more.
The results:
- During COVID-19, CrowdRiff galleries experienced 4x better engagement vs other parts of the website (engagement is a measure of interactions/views)
- The Top 10 Things to Do gallery had 134% higher views than one year ago
- The #LoveWanaka page had 14% views than one year ago
Ideas for increasing website engagement with CrowdRiff:
- Update the visuals in your galleries as often as you can, especially on high traffic pages
- Use a mix of inspirational and actionable imagery
- Add CTAs to every photo to drive people deeper into your site or to partner pages
- Add Google Locations to every photo so people know the location and operating hours of a business
Your social media engagement
It’s easy to get lost in all the different ways to measure social media engagement. Looking at the in-app analytics for Facebook or Instagram will tell you just how much there is to see.
Let’s keep it simple. Most destination marketers want to grow their social media presence. That means a larger audience, a more engaged audience, more clicks to your website from social, and more brand recognition.
Here are key metrics to track for social media engagement:
- Interactions. What are people doing when they engage with you on social media? Are they clicking on your profile or your website? Measuring this ensures people are taking the desired action on your social channels.
- On Instagram, go to Insights > Activity
- On Facebook, to go Insights > Actions on Page
- Followers. How many more followers do you have compared to last week, month, or year? How many people unfollowed you? Followers allow you to measure the size of your audience. The more followers you have, the wider reach your social media marketing will have.
- On Instagram, go to Insights > Audience
- On Facebook, to go Insights > Followers
- Engagement. How many likes, comments, shares, and tags are you getting? This is a sign of how much your content is resonating with your followers.
- On Instagram, go to Content > Overview
- On Facebook, to go Insights > Overview
- Hashtag use. How many times have people used your branded hashtags in the past week? This is a strong indicator of brand awareness and lends insight into the sentiment of your audience. If people are starting to use travel-related hashtags again, this is a hint that travel is back on their minds.
- In CrowdRiff, view Hashtag Insights
How the Alabama Tourism Department increased social media engagement by 48% with CrowdRiff
In the past, the Alabama Tourism Department typically focused on targeting those in the process of planning a vacation. As part of an effort to encourage current and past visitors to share their experiences on social media, they decided to run a contest.
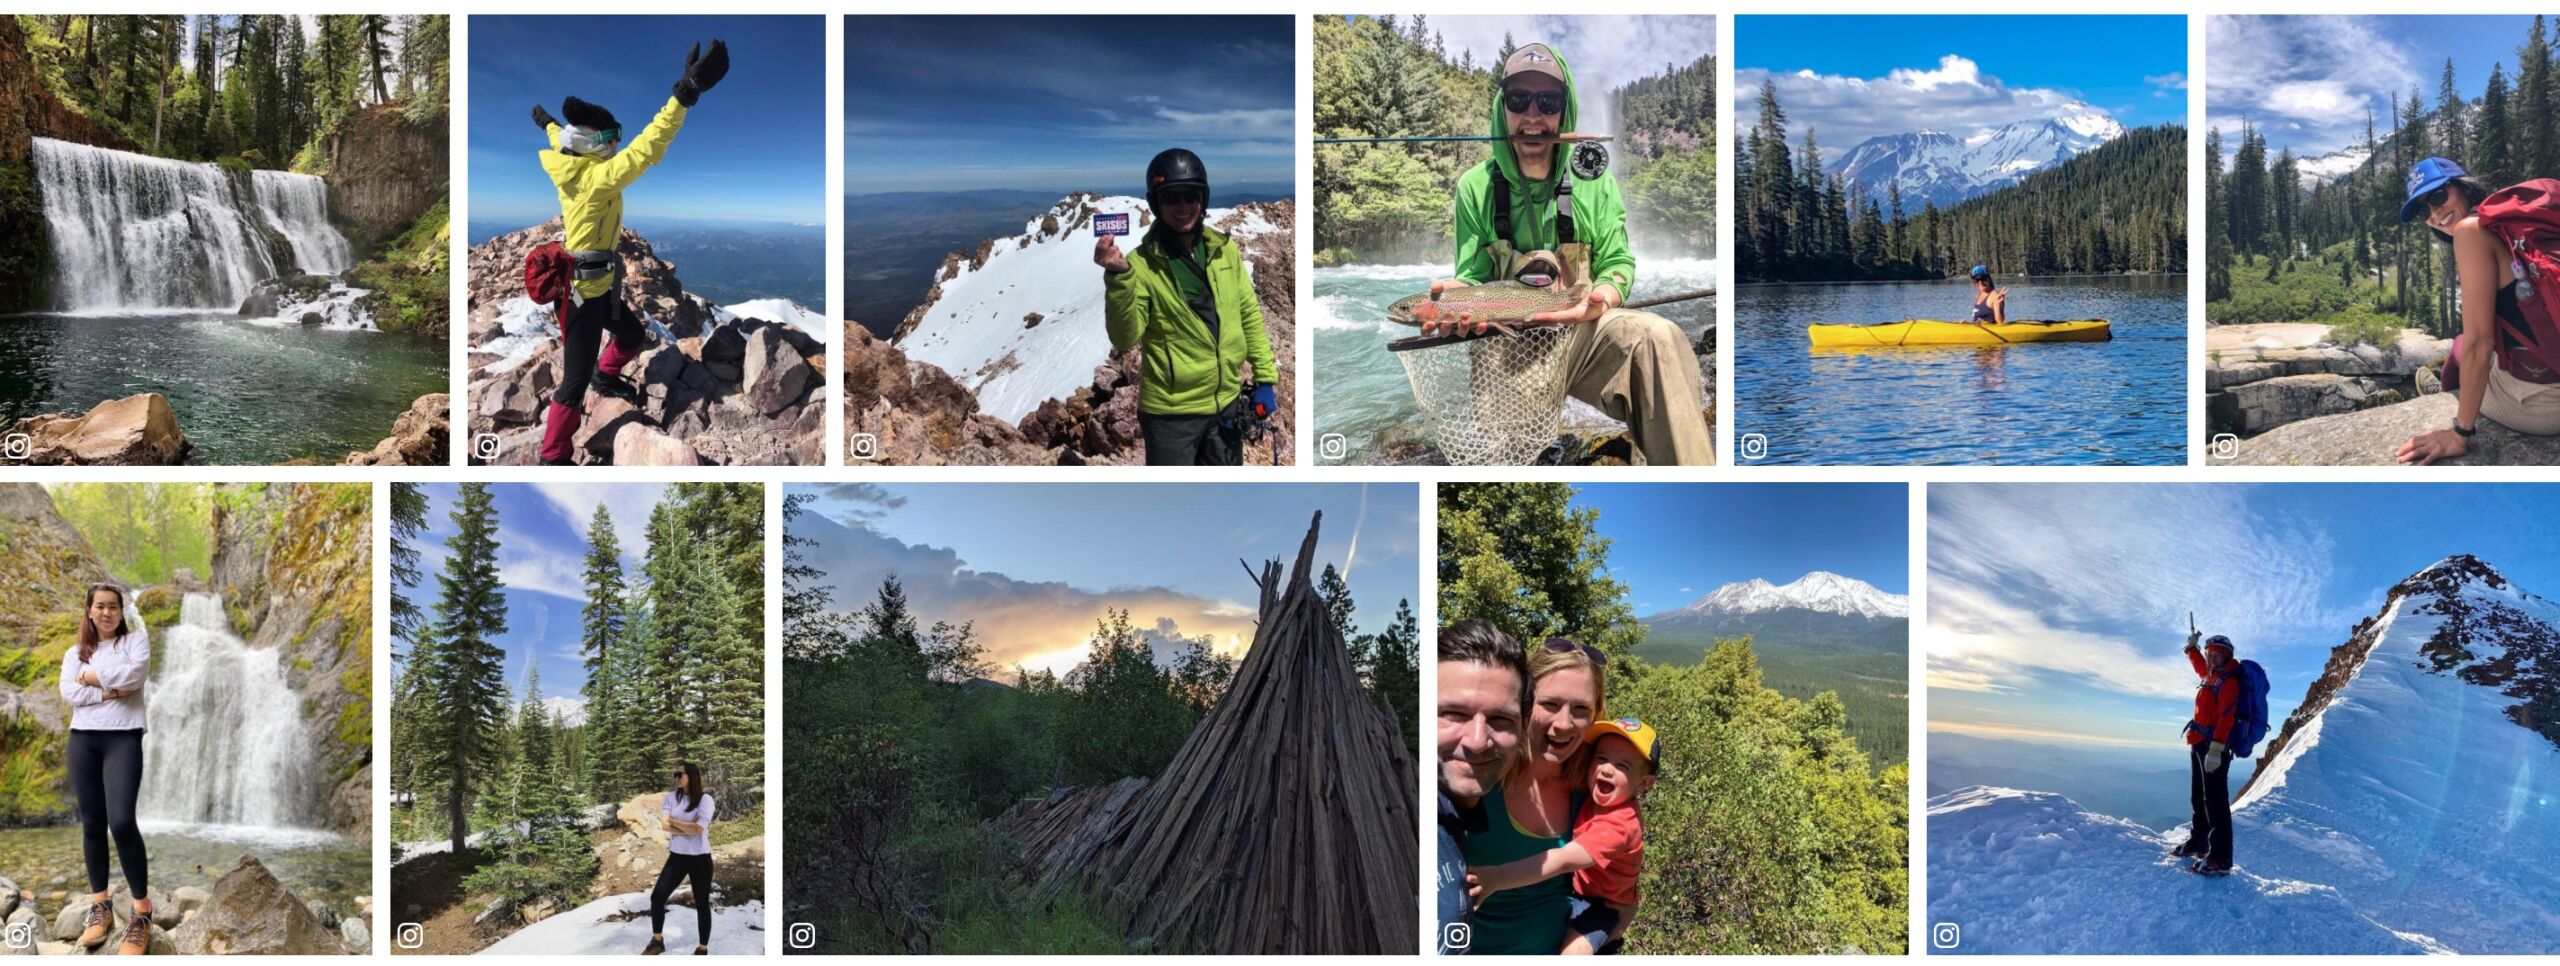
Instead of just using one hashtag, they worked with an agency that helped them decide it could better showcase Alabama’s diversity by dedicating one to each of the five senses. For example, foodie shots could be tagged with #TasteOfAlabama while landscape images could be tagged with #SightOfAlabama.
A few of the photos shared with the #SightOfAlabama hashtag.
They used CrowdRiff to follow hashtags throughout the promotion period to see how many posts were coming in. From that, they selected a winner from each of the five categories. Each winner received an Alabama themed gift basket.
Then, from the five winning submissions, social media users voted on their favorite photo. The top prize was a trip for four to the Gulf Shores.
Alabama Tourism Department’s Digital Marketing Director, Jo Jo Terry, said not only did CrowdRiff make it easy to manage the contesting, but it helped the team gather a large pool of user-generated content.
“In a state with so many unique and diverse attractions, user-generated content adds considerable credibility and depth to all our communications.”
And, of course, the contest created a noticeable lift in social media engagement.
The results:
- 800 more UGC visuals
- 13% increase in social media followers during the contest period
- 48% increase in social media engagement during the contest period
Ideas for increasing social media engagement with CrowdRiff:
- Promote a range of hashtags to appeal to all kinds of locals and visitors
- Make sure people know about your hashtag(s) – communicate them on social media, on your website, and in your email newsletters
- Run a contest to generate engagement and offer a prize from a local area business
- Regularly check your top-performing images and get the rights to similar content to republish on your social channels
Time saved per employee
When asked, 53% of travel marketing executives said resource restraint due to budget cuts was their top challenge right now, according to a Skift report.
With nearly every DMO operating with a reduced workforce, focusing on the right tasks is more important than ever before. Using the right tools lets you do more with less.
How do you know what to automate?
Repetitive tasks, like manually sorting through photos on Instagram that fit your brand, are more compatible with automation versus variable work (which is unpredictable and constantly changing), like strategizing with your team around a new website or campaign.
The key here is to “avoid the trap of treating all work as the same, and equally eligible for automation.”
To get an idea of what tasks make the most sense for automation, try this:
- Choose a period of time. This can be a day, a week, or a month.
- Measure the amount of time it takes you or a team member to complete each task.
- Give each task a rough measure of “repetitiveness.” That is, how predictable, routine, and predetermined is the task, versus something that involves more variables and interactivity.
For a social media manager, this might look something like:
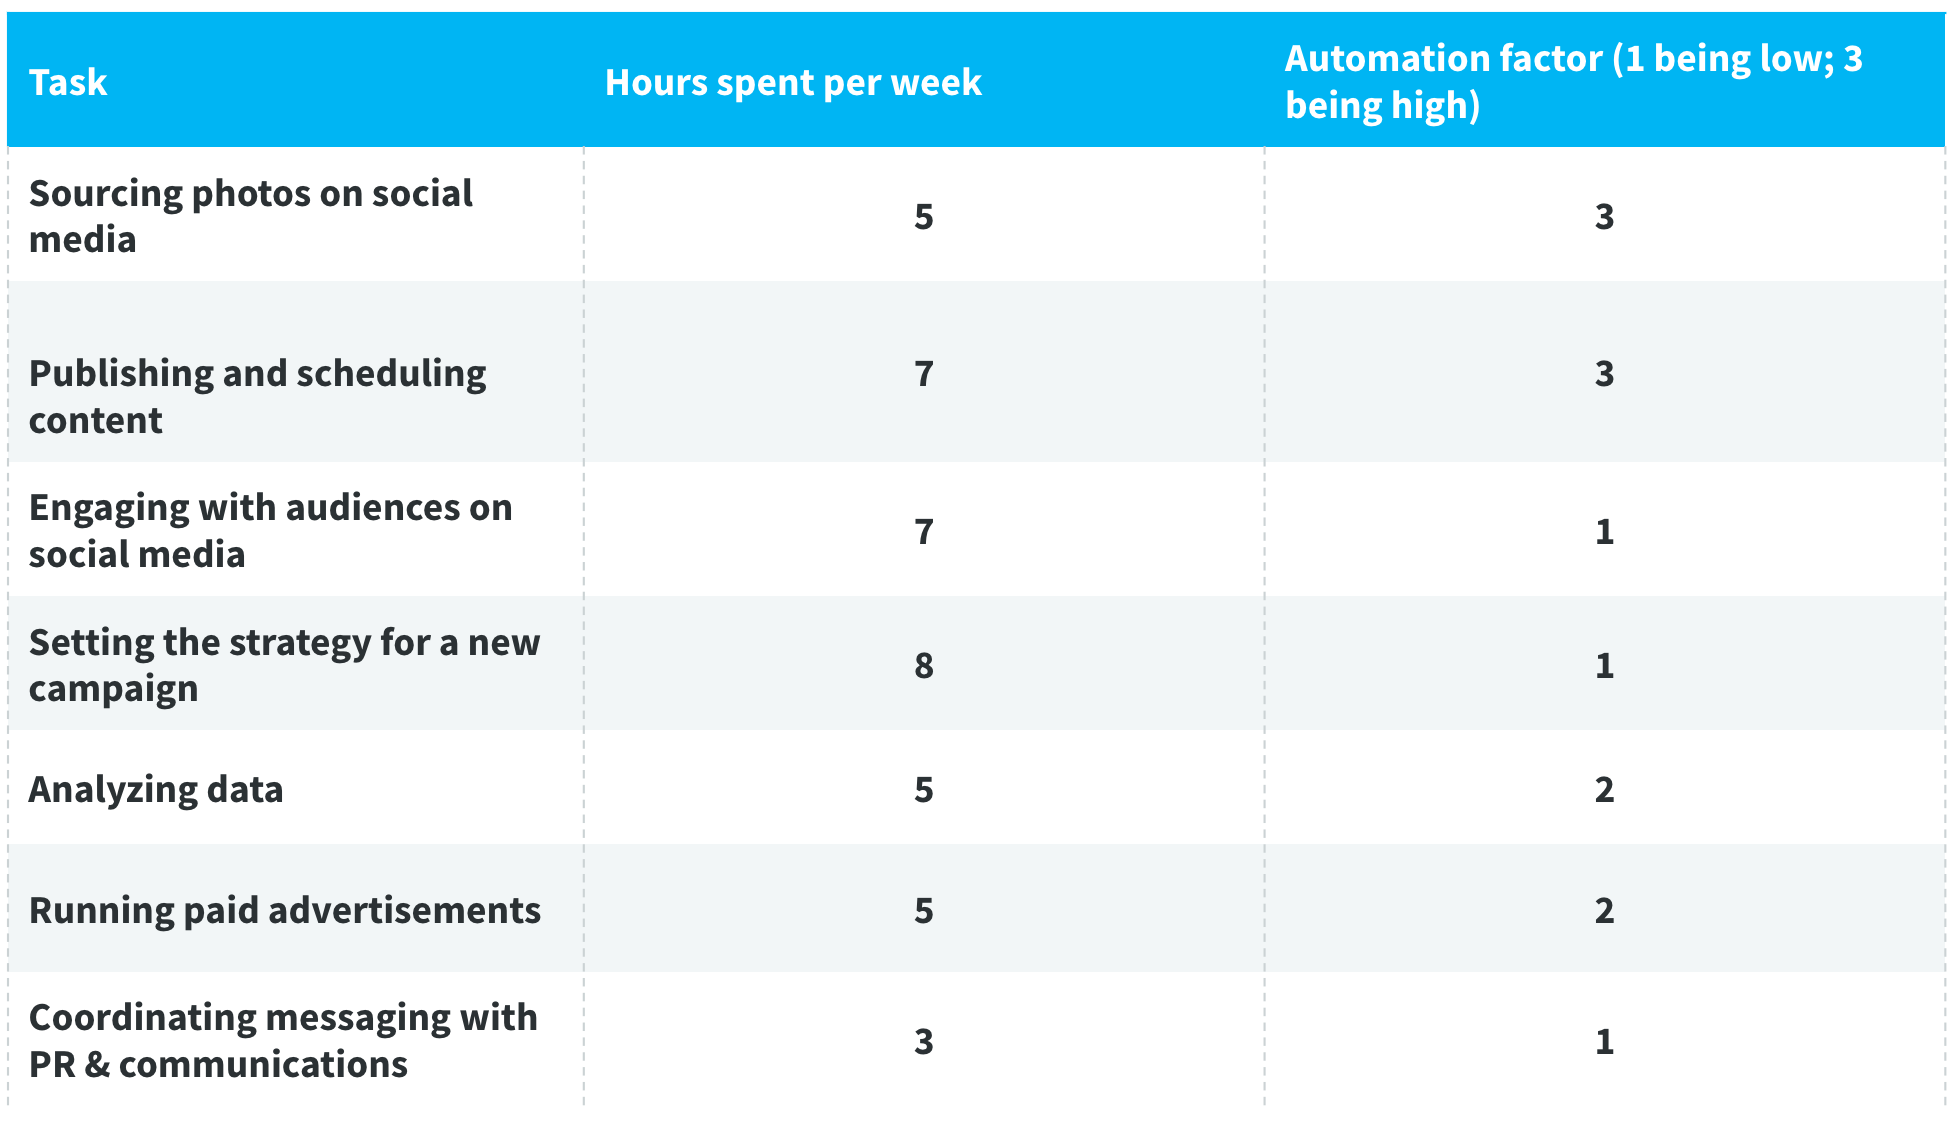
The most time-consuming tasks with the highest automation factor are the ones you want to use a tool for. In this case, that would be sourcing photos on social media and publishing them.
How Discover Siskiyou uses CrowdRiff to scale their marketing while saving time and money
Discover Siskiyou is a small team with a limited budget. Like many DMOs, they have the challenge of maximizing their budget while finding the right visuals to tell their story.
That’s one of the main reasons the team signed up with CrowdRiff. “It just made things easy,” said Megan Peterson, Discover Siskiyou’s PR and Content Marketing Manager.
Before using CrowdRiff, Megan used to send a piece of written content over to the web design team, who would add visuals based on what they had available.
A lot of the time, the photos didn’t match what they were looking for, and she often had to go back out and shoot more.
“With CrowdRiff, we have images of everything I could want, so it eliminates that back-and-forth, and they’re not wasting time and energy trying to shoehorn something that wasn’t exactly right either.”
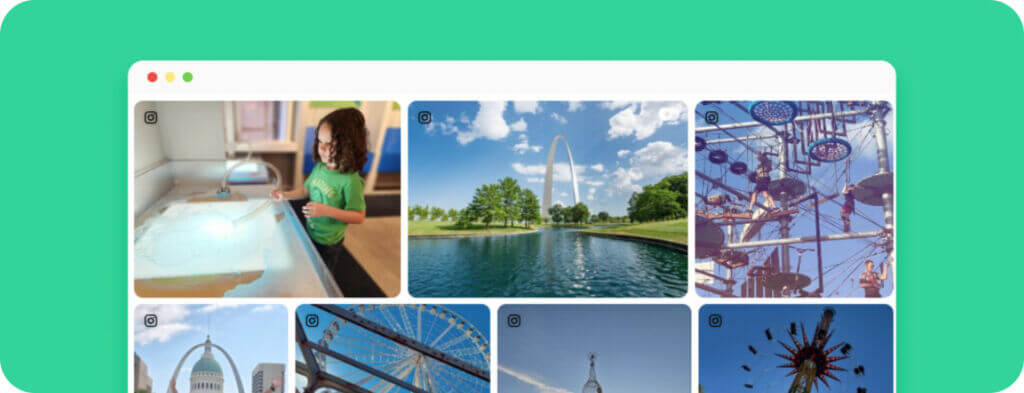
 A gallery on Discover Siskiyou’s homepage.
She’s not alone. Heather Dodds, Discover Siskiyou’s Digital Marketing Manager says she spends a quarter as much time as she used to finding content and getting the right permissions.
“You’re a better steward of stakeholder dollars when you’re not spending an hour finding a photo; now we can do something more productive.”
“I probably spend half as much time doing what I was doing in the past. We can make the ROI argument just on staff efficiency alone.”
Questions to consider:
- How much time is my team spending on searching for the right photos on social media per hour, per week, and per month?
- If that team member had those hours back in his or her week, what other tasks could they be doing instead?
- How could an automated solution help our team be more productive?
The value of your user-generated content library
One statistic that is often overlooked is the value of user-generated content you’ve acquired.
This is often the content DMOs are using to keep their website up-to-date, their social media channels current and trustworthy, to support their partners, and often power their other marketing channels through the recovery and beyond.
The value of your UGC library also lets you know if you’re getting the most of CrowdRiff.
To get a rough estimate of the value of your UGC library, ballpark the following:
- The estimated price of a stock photo. a) A stock photo can cost anywhere between .50 cents per image to almost $10 per image, not including the price of the subscription. Keep in mind these don’t always include video.
- The estimated price of a professional photo or set of professional photos/videos. These could include costs like models, actors, and photographers as well as the time you spent coordinating them.b) Depending on the skill level of your photographer, they can charge up from $50 – $1000+ per hour. These often include a package or set of images.
- The number of user-generated content images in your library.
For the sake of this example, let’s pretend you have a deal with a local photographer who charges $50 per photo. If you wanted 400 photos, it would cost you $20,000.
Now, imagine you have 400 high-quality, rights approved UGC images in your CrowdRiff Library. Let’s say your CrowdRiff subscription is $10,000/year. So that means that you were able to source $20,000 worth of images for a cost of only $10,000 – or an ROI of 200%.
While this formula doesn’t cover everything, like the cost of working with influencers, it’s certainly a start to showing some hard numbers around the value of your user-generated content library, and the ROI of a tool like CrowdRiff.
How Visit Mesa ran a photo contest to collect 500 UGC photos in two weeks
Collecting visuals from your community is an effective way to quickly increase the value of your UGC library.
Visit Mesa team ran a photo contest to capture UGC for a music video called “For the Love of Mesa”. In the past, they created this video with professional photographers and videographers, but this year they wanted the content to come from locals.

To easily collect these photos from locals, they used the CrowdRiff Collector, which allows people to directly upload their UGC to your CrowdRiff library. This is great for photo contests, like Visit Mesa, but also for capturing high-quality photos and videos that aren’t shared via a hashtag.
Their goal was to capture 200 photos from the community, but it didn’t take long to exceed it.
“We were able to not only get content for our project but also get great content for future use. Essentially we got almost 500 user-generated photos in a matter of two weeks. We didn’t have to do a lot of asking around or searching for it,” says Kate Eckstein, the Digital Strategist at Visit Mesa.
The team at Visit Mesa uses the content to market the city to locals and, as they reopen, attract out-of-state visitors.
Image credit: @willianjusten